.png)
Q1 2026 data from the Jewelers Board of Trade (JBT) shows a steady retail environment and improving supplier conditions, but rising credit risk remains a key concern across the jewelry industry.
Note on Data Changes from Andrew Rickard, President & Treasurer
As we continue to evaluate the policies, procedures, and data provided from the Jewelers Board of Trade, I wanted to let everyone know that you can expect to see some changes in how the data is evaluated. Retailer listings, new businesses, and closures will be analyzed via their location around the country and Canada. Suppliers (wholesalers and manufacturers) will begin to be evaluated by their type of business in Q2. We feel that these shifts will help bring to light more of what is happening with jewelry businesses across North America.
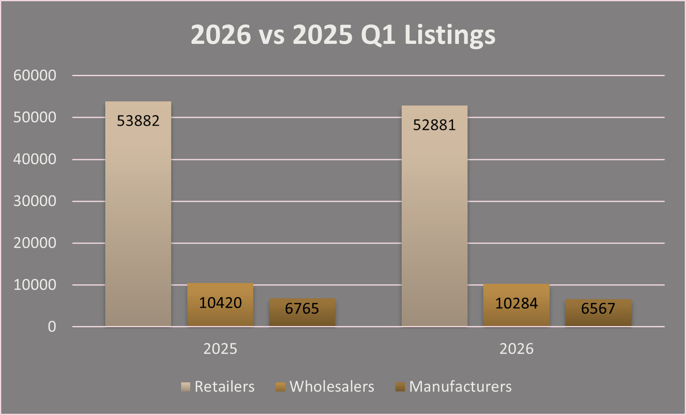
Listing Information
North American total listings continued their trend of slight reductions, losing 431 retailers (-2.4%) and 125 suppliers (-2.18%). This is a sizable improvement from what we saw in Q1 2025, however, when there were 636 retail and 195 supplier reductions. The retail category continues to show its strength and resilience.
New business openings exceeded last year, coupled with businesses ceasing operations, consolidations/sales, and bankruptcies plummeting by almost 24%. A net increase of 44 more stores were operating YOY at the close of the quarter. The Southeast, South Central, and Northeast show the strongest growth. The North Central region saw a sharp decline in new business additions YOY. On the ceased operations side, the South Central, Southeast, and Southwest also shined with fewer reductions in businesses YOY.
 The supplier side of the message is more mixed. There were 7 fewer businesses added YOY. However, ceased operations, consolidations/sales, and bankruptcies were down dramatically: 32 in 2026 vs 45 in 2025, a 28.9% improvement. This was driven substantially by a reduction in manufacturers ceasing operations (17 in 2025 vs just 7 in 2026, a 58.8% reduction).
Financial Statistics
Ratings data shows stability. Decreased ratings were down, and increased ratings were up. This contrasts with both 2024 and 2025 Q1 numbers, which showed the opposite. Further, the quantity of changes was less. Those doing well are holding their position or improving it, and those struggling aren’t finding much respite.
.png?width=695&height=411&name=2026%20Q1%20Claims%20(002).png)
As for those poorer performers, their claim activity is on the rise. JBT can share that claims are up, as is the average amount per claim. Q1 2026 has seen a 54.4% increase in claims YOY, with a 16.8% increase in the amount per claim. Both are sizable increases rolling into 2026. Not quite the volatility of 2024, but far from the minimal claim activity experienced last year.
Stay Ahead of the Jewelry Market
These quarterly highlights only scratch the surface. JBT Members get our full Vital Statistics Report plus weekly tracking of credit changes, closures, new businesses, and bankruptcies. Join jewelers who turn data into decisions.